The Heikin Ashi Candles chart is a technique for observing the price action more precisely and with less “noise.” The technique bases its calculation on the average price growth rate. Consequently, it offers the chance to clearly identify market trends and eventually improve price predictions.
For most traders, the Heikin Ashi is dependable as it enables traders to interpret trends more accurately on candlestick charts. Showing potential reversals or breakouts also aids in helping traders determine good entry points.
Applying Heikin Ashi in trading helps users critically convert the intense market volatility into valuable information. Additionally, it offers a strong foundation for establishing an investment commitment by helping to objectively define and highlight the market’s state.
Heikin Ashi Candles: The Basics
The Heikin-Ashi Candles is a Japanese candlestick-based technical tool that employs candlestick charts to show market price data.
In Japanese, Heikin refers to average, and Ashi refers to pace. Together, it means the average pace or average bar of security prices.
This chart uses a type of technical analysis that examines an asset’s price fluctuations in relation to a larger trend.
For instance, you can make a better and more informed decision about whether to enter or exit a trade if you can see the overall trend more clearly.
Heikin Ashi candles will show four separate price levels (lowest point, highest point, open and close prices), but their values will be derived from data from the current and prior sessions.
Meanwhile, Heikin Ashi candlestick can be applied to the same time values as standard candlestick charts, making them helpful for scalping, day trading, and position trading.
Heikin Ashi Formula and Calculation:
The Heikin Ashi formula allows you to calculate each candlestick chart on the charts. However, this chart’s calculations are quite complex in comparison to other standard candlesticks.
Here’s a simplified formula to calculate the Heikin Ashi candlestick chart:
- Open position = (Previous bar’s open + close of the previous bar) / 2
- Close Position = (Current bar’s high + Low + Open + Close) / 4
- High = The current period’s maximum value from the high, open, or close.
- Low = The current period minimum value from the high, open, or close.
Building Heikin-Ashi Candlesticks Chart:
The Heikin-Ashi chart is built similarly to a standard candlestick chart, except that the method for calculating each bar is different.
The user defines the time series, which can be daily, hourly, or five-minute intervals, depending on the chart style needed.
The full candles indicate the low days, while the empty candles reflect the happy days. The charting platform may also color these in. For instance, up days are white or green, and down days are red or black.
How Do You Read A Heiken Ashi Candle?
The best part of using Heikin Ashi charts is that they can be used in any financial market, whether it’s Forex or Stocks.
There are five primary signals in Heikin Ashi Chart that identify buying opportunities and current market trends.
So, let us tell you how to read Heikin Ashi Chart:
- The candle’s high is at the top of the upper wick.
- The bottom of the lower wicks is the candle’s low.
- The body is the difference between the open and closing prices of a session.
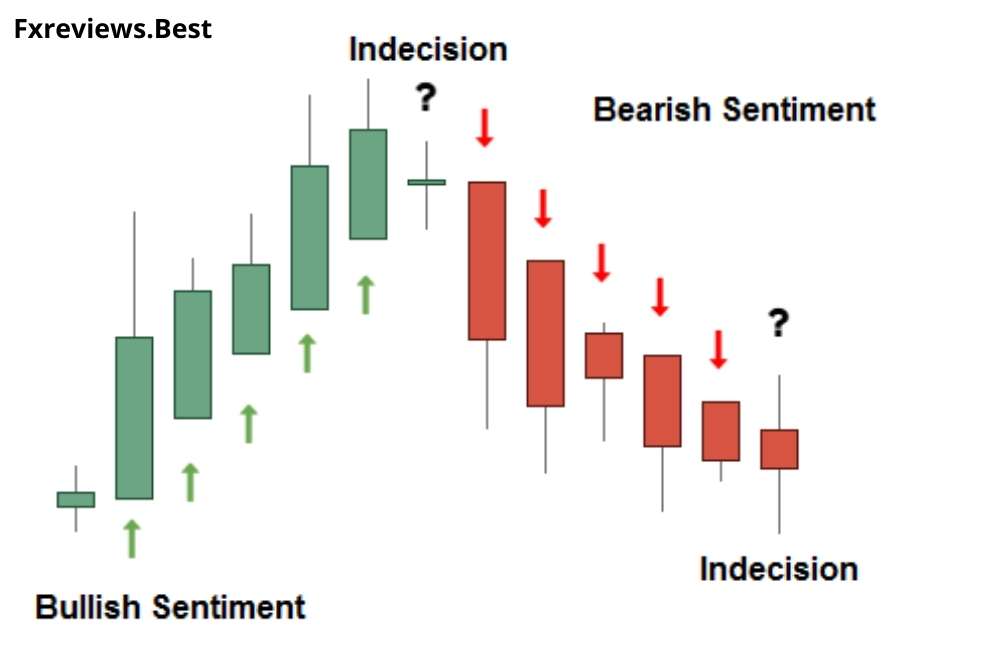
- If the candle is green, the closing value is greater than the opening value.
- If the candle is red, then it represents the lowest value than the opening value.
- Green candles with upper “shadows” represent a strong bullish trend.
- Blue candles represent an upward trend, while magenta candles represent an uptrend that might be losing its bullish momentum.
- An uptrend is indicated by hollow or green candles, which help you decide entry and exit points.
- A white candlestick represents a time when the price of the security closed higher than it had opened.
- Candles with very small body surrounded by upper and lower shadows represent a trend shift.
- If you see filled or red candles, it’s time to add to your short position and leave your long position.
- A strong downtrend is indicated by filled or red candles with no higher shadows: In this, traders should keep it short until the trend shifts.
These chart patterns may make it easier for traders to find trends and the best trading opportunities compared to traditional candlestick charts.
Trading With Heikin Ashi Candles Chart: A Step-by-step Process
Here’s a step-by-step guide on how to start trading with Heikin Ashi:
- First of all, calculate the momentum using a higher time frame chart. You can find breakout scenarios using the patterns the price action shows, such as triangles or wedges.
- Mark the main points of support and resistance that may impact price movement.
- Look for Heikin Ashi buy and sell signals in lower time frames when the trades’ direction favors the momentum of higher time frames.
- Have a predetermined level where your stop-loss order can be placed to manage trade risk and buying pressure.
Heikin Ashi – Indicators and Signals:
These Heikin Ashi charts show the ongoing trends in the market through indicator signals. There are two major types of Heikin Ashi indicator signals: Trend Strength and Trend Reversal.
Trend Strength:
The first step is to assess the trend’s strength. Due to the smoothing effect of the indicator, small corrections may not be evident on the chart.
As a result, while using the Heikin-Ashi chart to trade in the trend, it is recommended to apply a trailing stop to increase the benefits of trading within the trend.
If the trend is strong, it is advised that a trader continues in it to profit from it. The trends for Heikin-Ashi are further divided into three types: Bullish or bearish trends and Triangles.
Bullish Trend: The appearance of a large number of successive green candlesticks without lower shadows indicates a strong signal.
Bearish Trend: The appearance of a lot of successive red candlesticks without upper wicks indicates a significant downtrend signal.
Triangles: The uptrend will emerge when the indicator breaks above the upper of a symmetrical or ascending triangle.
Trend Reversal:
This indicator signal helps traders determine the best time to exit the existing trend-following trade and enter the new trend.
By using the trend reversal indicators, traders can mitigate the high loss chances by entering a new trade. There are two types of Trend reversal indicator signals:
Doji Candlestick: It shows a short body with a long shadow. It represents market uncertainties. In the Heikin Ashi technique, it represents a price trend reversal.
Wedges: The wedges are just like triangles. The rising wedge tells traders to wait till the candlestick goes below the indicator’s bottom line.
Meanwhile, a falling wedge refers to waiting till the candlestick break above the indicator’s upper line.
Pros of Heikin Ashi Candles:
There are numerous benefits of using the Heikin Ashi candles while trading financial instruments.
Here are some major advantages of Heikin Ashi Candles:
High Readability:
Traders often prefer to choose charts with high readability. In this series, Heikin-Ashi candlesticks are more easily understandable and readable than traditional candlesticks charts.
Reliability:
Heikin Ashi chart is the most reliable and accurate charting tool. This is because it uses historical price movement to predict future trends. Meanwhile, this historical data is highly dependable.
Accessibility:
Heikin Ashi chart is one of the most accessible charting tools that doesn’t need to be installed. Additionally, it is available on all major trading platform such as InvestBy.
Filters Market Noise:
The concept behind using a Heikin Ashi chart for trading is that it filters market noise. And when the noise is filtered, you see the naked trend and trade even more efficiently.
Tolerant To Any Timeframe:
The best part of using the Heikin Ashi charts is that it is tolerant to any timeframe from hourly, monthly, daily, etc. However, large timeframes are always reliable and better.
Tips For Trading With Heikin Ashi Candles
Heikin Ashi charts are really very powerful when used in conjunction with price action analysis.
Here are some important tips for trading with Heikin Ashi Charts:
- Always search for support and resistance levels and note down important swing points as they could work as future turning points.
- Before deciding on an entry point, it is important to use a stop-loss order.
- Wait until the price action goes into a potential trend reversal.
- Remember, a big opposite candle may show a shift in sentiments.
- Look out for new trends to emerge, starting f trend pauses or for the reversal of already existing ones.
Final Word About Heiken Ashi Candles
Heikin Ashi Candlesticks are a powerful tool that chartists may use to filter noise, predict reversals, and identify classic chart patterns.
On the other hand, these charts can be used to apply all aspects of traditional technical analysis. Chartists use these charts to define support and resistance, create trend lines, and quantify retracements. However, a good understanding and investment advice are always a need of the hour.
As now you may have fully understood the Heikin Ashi Candlesticks, it’s time to put your practical knowledge to work by. So, start trading with Heikin Ashi Candlestick by just opening a trading account with InvestBy today! Alternatively, you can practise trading through InvestBy’s demo account.
FAQs:
Are Heikin Ashi Candles Good For Day Trading?
Yes, these HA candle charts are quite useful for all short-term trading strategies, including Day trading, Scalping, or even Swing trading.
These candlesticks are perfect for day traders, scalpers, and swing traders because they are crucial for spotting market trends. These modified candlesticks apply to any market and time frame for traders.
Are Heikin Ashi Candles Accurate?
These candle charts are quite easily understandable in comparison to other traditional charts. Meanwhile, it is the most accurate and can easily identify trends and price movements. It makes use of historical data, which is also quite reliable.
What Indicators Are Best With Heiken Ashi Candle Charts?
There are several indicators that work well with Heinkin Ashi, including moving averages, Bollinger bands, and the Relative Strength Index (RSI). these indicators are the ones that you are most familiar with.
Is Heikin Ashi Profitable?
Heikin Ashi candles can be profitable but for long-term trends. For the trend-following strategy, these candle charts produce a considerable win percentage. Additionally, it is simpler to discern market patterns and movements because Heikin-Ashi candlesticks are easier to read than typical candlestick charts.
How Are Heikin-Ashi Candles Formed?
Heikin Ashi candlesticks are formed by combining the midpoint of the previous bar with the open, high, low, and close of the current bar, as opposed to using the current bar’s open, high, low, and close to forming the bar.
How To Use Heikin Ashi?
Examining the shadows, Heikin Ashi data shows you the trend’s strength (or wicks). This chart uses a type of technical analysis that examines an asset’s price fluctuations in relation to a larger trend. For instance, you can make a better and more informed decision about whether to enter or exit a trade if you can see the overall trend more clearly.
What Is The Difference Between Traditional Candlestick Chart and Heikin-Ashi Chart?
A Heikin-Ashi candle has a body and wick, just like a regular candlestick chart; however, it serves a different function. Additionally, the settings for Heikin Ashi do not differ from that of normal candlesticks, except it shows real prices on the price scale, which is responsible for showing the label of the last price.
Do Traders Use Heikin Ashi Candle?
Yes, many technical traders use Heikin Ashi in conjunction with technical analysis to help them spot trends.
How Do Heiken Ashi Candles Work?
Technical traders can more quickly recognize a trend by using the Heikin-Ashi technique. Strong uptrend is indicated by hollow white (or green) candles with no lower wick, and strong downtrends by filled black (or red) candles with no upper shadow.
What Is Red Candlestick?
A red candlestick is a type of price chart that indicates that a security’s closing price was lower than its open and previous close.
What Are Different Types Of Trends For The Heikin Ashi Technique?
The trends for Heikin-Ashi are divided into three types: Bullish or bearish trend and Triangles.