
Moving average is the technical analysis that a trader uses to get stock indications in the process of investing. It uses mathematical formulas and terms to get the various moving averages per instrument or trade. The types of moving average help the trader predict prices in advance with the help of the calculations.
Moving averages are four types of moving averages that make trade easy in the financial market. Simple moving average, exponential moving average, smoothed moving average and weighted moving average. All four have different functions in the trade but the same motive of getting the price averages for the trader. Thus, making the trade smooth and easy for investors.
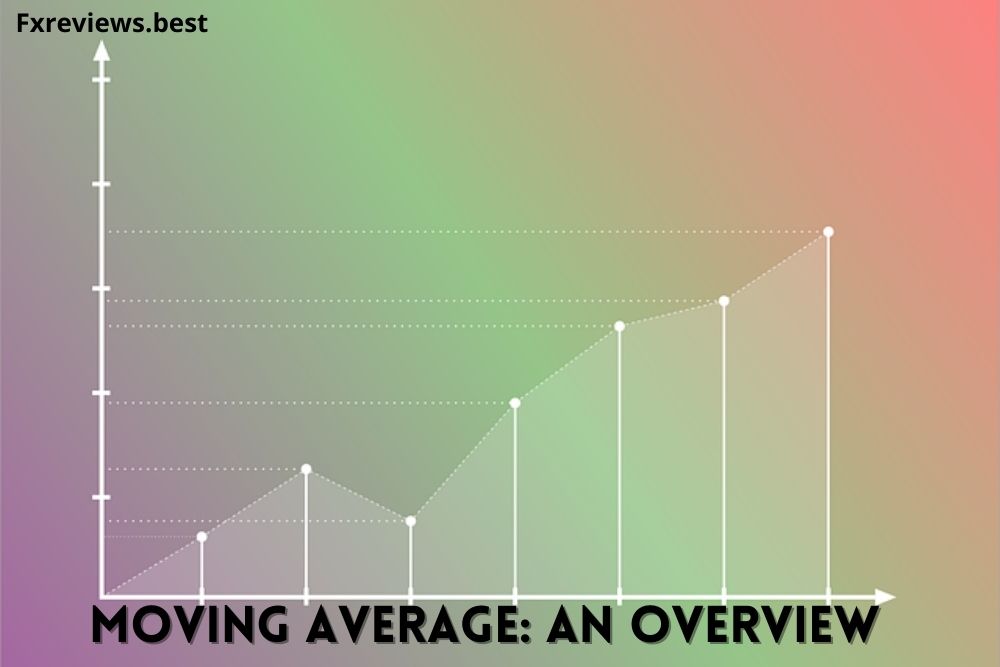
Why do we use Moving Average?
The moving average is read through graphs or charts indicating price movements and what made the change. It removes the noise of unnecessary things in the chart. A trader investing requires the support of moving averages in the long and short-run as the price movements from the start could be analysed to get an idea of future trade actions. A remarkable technique that updates the trader and the market with proper information on price. With the signs of moving average, the trend is known. If the chart shows an upward move, it is price increasing, and if the line is downward, then the price is lower than it should have been. The chart can also show a sideway moving average where the change in the price movement range is visible.
The movement of the data points in the periods is a basic idea of price changes and getting the strategies made. The moving average is the sign of both opening and closing prices, with the arithmetic means and other mathematical standards for the perfect idea of the average price. The period and recent price data are necessary to get the design of the moving average.
Moving average is important for support and resistance as well. These are noticed with the chart patterns. An upward trend is a support, and a downward trend acts as resistance. The price keeps changing with the market volatility, and the moving average shows the change. The length of the moving average varies and indicates an uptrend and downtrend for a certain situation.
Types of moving average
As we discussed, four types of moving average help traders decide their future course of action. The moving average differs for the type of instrument a trader deals in and the financial market. These are calculation methods for the moving average so that the exact plan could be designed and executed. We’ll be discussing the kinds and their functions.
Simple Moving Average
It uses the formula where the prices, mainly closing prices, are taken, and the average is derived from the price dividing it by the time period range. A simple method using the arithmetic mean. It helps the investors know about the market trend and which direction the price will continue its move.
A simple moving arithmetic average that is calculated with recent price data and periods. For example, if the closing price is taken 10,20,30,40, and then these are divided by the time period to obtain the average of the whole trade. The time period is, say, 30 days, so that the simple average would be 3.34.
The simple moving average is used in the short and long term; in the short term, they are a quick indicator of change and are responded at the same speed. On the other hand, the long term is for a period of time and thus takes some time to reply.
The formula of Simple moving average:
A1+A2+…….. An
n
In this, A is the price of the security, and n is the total time period.
Exponential Moving Average (EMA)
The word exponential stands for a rapid increase in something and the trading field; it helps to derive a weighted average. It is acquired using the most recent price data, reacting more quickly than the simple moving average. Thus, applying equal weight on the total observations. It is a technical indicator that shows buy and sell signals to the trader based on the averages of the closing prices, where a trader can use 10 days, 60 days or 180 days moving average.
The exponential moving average formula is:
As the moving average works on recent data points, the formula uses today’s and yesterday’s calculations.
EMA = (Value (today) X (smoothing) + EMA (yesterday) X( 1-( smoothing)
( 1+days )
Smoothing is two but could be more or less as well. When the smoothing factor is increased, then the recent statement influences the exponential moving average.
The exponential moving average uses a simple moving average for its calculations of the price change.
Smoothed Moving Average
Smoothed moving average is a long period moving average that considers the price data for a longer period with the weight assigned. It is a method that uses the oldest price to calculate the price data with a minimal impact in the present. It aids the traders in removing the short term fluctuations, and new trends could be checked. Smoothing eliminates the noise from the data set, and that’s what it works in moving average. It takes up all the old and new data, removes the noise and gets the moving average of the range of security. It analyses data points with less impact on the old prices.
Moving average indicators are a good source of finding the change that occurred in the security price within a time period. In smoothing, the fluctuations are removed, and the trend prevails with the correct notion of the price trends when the price is above the smoothed moving average, then trader purchases and sells when the opposite happens—a good source of liquidity security in the market. A different moving average than the simple moving average and weighting is the main factor in knowing the trend. Therefore, smoothing price data is significant for a trader’s investment.
Weighted Moving Average
The weighted moving average gives more weightage to the current price than the older price changes. The sum of weight should be 100 per cent or sum up to 1. This is because the simple moving average distributes the weight, whereas the weighted moving average uses the combined weight.
The formula of weighted moving average is :
WMA = Price1 X n + Price2 X (n-1)+…….Price n
n X( n+1)/2
The trade with weighted method gets the buy and sell data and indicates investments with more weight to the recent data point and less on previous data. In addition, the high and low prices of the trend in the chart help traders decide over the investments through the support and resistance levels. Thus, this method generates helpful signals for the traders—providing more accurate trend directions than other calculated methods.
Moving Average Length
The moving average length is the days or, in trading terms, time period of the security. It helps the trader to calculate its worth with respect to price. The technical analysts prefer the moving average length in their formulas to get exact price action in the time period. Considering both past prices and current, the market momentum is depicted through the same chart. The most used moving average length starts from 10,20,50,100 and 200, applicable on any chart time frame as per trader’s time zone. The time frame could be a minute, day, week or month.
These are the lookback periods of the trading security to get the price changes. The market momentum and price actions play a big role in getting the strategies made for future trade. The shorter time frame will immediately impact the price change, while the long time frames have a comparatively slow impact.
It uses lag, that is, the time of the moving average, to signal the reversal of the trend. The lag price action is different for time frames in the stock market or any other trade. The up and downward movements of the trend and sudden changes are the lags of the trade.
Historical data are also helpful in such situations, and the trader can check the price changes and adjust the moving average. For example, it could be 15 or 90 etc.
Strategies
Crossovers are the popular trading strategy that is used in moving averages. As the name says, it is the crossing of the moving average. When it crosses the moving average above or below the price, this signals the price change. Thus, it is the first strategy that a trader applies to get an idea of the market trend.
The second strategy is when two averages, simple moving average(SMA), exponential moving averages, or other two. Again, it could be in the short or long term, and both have different impacts. The short term of moving averages when long term moving averages, then a trader buys the security in the market—a golden cross showing an upward trend.
And similarly, when the short term is below the long term, then the trader sells. It is a sell signal and is a downward trend. This is termed as dead or death cross.
Moving Averages Advantages
Creating a visual aid in front of the trader the moving averages are a helpful trick for investors to invest as per the market trend. The moving average line on the chart also shows the support and resistance levels; thus are the best for price reading. This paragraph discusses the advantages that moving averages share with their components: simple moving average (SMA), Smooth moving average, Exponential moving average, and Weighted average. So, let’s head straight into details:
Moving averages is a core part of the stock market, used daily by traders to get price moves and lagging indicators. These help traders to know the current value impact on the trend of the market. The different values and greater weight tell about the price movement with the longer-term moving average and short-term average. In trading and trend check, old data are also useful for a big picture of the trade.
They are an excellent source for analysis through the smooth price data, and arithmetic mean. A well-suited method for recent prices and trend direction. It helps the trader to understand the charts and indicators of the market.
Simple averages are simple and the best for trade in the forex market. It is used with candlestick charts and other patterns for the perfect predictions. A formula used in this average method is easy with arithmetic solutions.
Exponential moving average (EMA) is a method based on a simple average but has other qualities. Giving more importance to the current price and data than the older one. It shows the perfect trend change with the use of a simple formula.
Moving averages are also valuable for knowing the support and resistance to being a better market trader.
Moving averages are simple and require knowledge of the formulas and mathematics to get perfect forecasts.
The charts have the facility of multiple moving averages in one trade as per the trader’s requirement.
The moving averages have various strategies like crossover and the use of two or more weight averages together. So a trader can analyse the data points with technical analysts and check the price action.
Disadvantages of Moving Averages
The first and most primary disadvantage of moving averages is that the data used in the analysis is historical and not based on current prices. Hence, the predictions could be wrong.
The indicators do not sometimes consent, these show respect, and sometimes they don’t show respect to the resistance and support.
The multiple trend reversals could be confusing for a trader.
They work poorly in the ranging conditions. The time frame changes are required to solve this issue.
If not good at mathematical formulas, the trader may not do well with the use of resistance moving averages.
Lag Factor
The lag factor is visible with the long term moving averages. The greater the average, the more we have the lag. Moving averages have a lag factor included due to the past prices in the calculation of the average. The moving average itself is the indicator of the lag as they go long. A trader who trades for a period of the time faces lag and does not get speedy decisions on the trade and trend. Past data made the trend slow and lagged with slow changes.
Best Broker for Online Trading
Global TradeATF
The brokerage website is the best in the world for the moving averages. They have some of the best facilities for the traders to minimise their risks and increase profits. The traders have security in the financial market with TradeATF brokers. They are CFD brokers with the IFSC license number IFSC 60/322/TS16. Besides being reliable, they have 250 plus assets for traders to have total exposure to the forex market. The instruments that it provides are precious metals, commodities, CFDs, ETFs, forex currency pairs, stocks, cryptocurrencies and indices.
The broker has the most user-friendly trading platform, MetaTrader4. It has expert advisors, timeframes, indicators and analytical tools to ease the trading. With the functions, the trader can enjoy a smooth experience and trade with technical and fundamental indicators. These indicators also include moving averages to make calculations and get chat patterns to forecast and predict their future decisions. In addition, the trader can access the online trade with various accounts and minimum deposits—a good choice for traders to do advanced trading and have profits. Open an account and start your trading with TradeATF
Conclusion
Traders are part of this race in the financial market to earn and fulfil their extra needs. For this purpose, they use brokers and online accounts. As the technology advanced, so did the traders or investors. The public started using trading tools and analysis to have a future trend in mind. The predictions of price are made through moving averages and charts that the trading platform provides. So, the traders started using the technology for ease of trade and to have time for themselves. There are many such techniques to analyse and plan the trade with a profit. But moving averages work on price factors, and it is significant for trade. The price changes are noticed with moving averages on the charts. The right signals will make double profits for the trader—a suitable and efficient technology with favourable effects.


