In the competitive trading world, traders need to understand the usage of various charts, especially in the foreign exchange market. Japanese Candlestick charts are hands in gloves with the forex market when it comes to seamless support. The chart is used for technical analysis of currency pairs that exhibit closing, low, high and opening prices. Forex traders utilise them for buying and selling their assets.
These charts help them deeply understand the forex market and its theatrics by weeding out the doubt and other concerns related to profits and losses.
Origination of Japanese Candlestick charts
The origination of Japanese Candlestick charts dates back to more than a hundred years; before the west developed different charts, including point & figure and the bar. Interestingly, the observation of rice’s demand and supply gave birth to the Candlestick charts. Homma, a Japanese man, discovered how traders’ emotions influenced the market. It was the 1700s when it happened.
Japanese Candlestick charts exhibit collective emotions through visualisation. It showcases price moves through myriad colours. Forex traders utilise Candlesticks by acknowledging the pattern of trading and create a strategy around them. People can forecast the futures market and direction before going for an investment in a currency pair. Mostly, it is for the short-term one.
Here, the past patterns are instrumental in determining the future price movement of a forex asset. Japanese Candlestick charts display four price points: low, high, open, and close of a specific period signified by a trader.
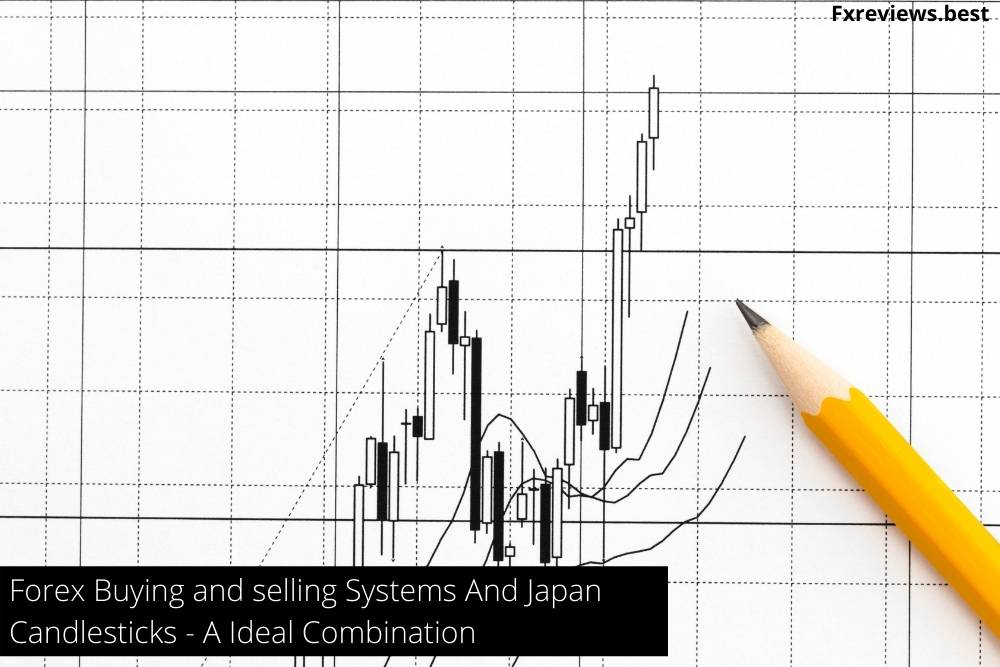
The wide part of the Japanese Candlestick chart is known as the ‘real body’.
The ‘real body’ exhibits the price range between day’s open and close trades. When you see the real body all black or filled, it represents a lower closing price than the opening one. Likewise, if the closing price is better than the opening one, a blank or white ‘real body’ displays that.
Interestingly, traders have the option to alter the colours on their platforms. Thus, brokers like ROinvesting, HFTrading, PrimeFin, IGM FX and Global TradeATF can be useful while making an effort.
PS:- Sometimes, up candles are shaded in green rather than white. Also, the black ones are coloured in red.
Basic features of Japanese Candlestick charts in the forex market
For knowing the details of each day in the forex market, Candlestick charts guide traders through three basic but essential features.
- The colour
- The Wick
- The Body
Each of them comes with a utility that helps traders know the market’s direction, highs and lows in intraday and ranges of close and high.
During intraday trading, traders use the Wick to determine the lows and highs of forex currency pairs.
With time, traders use patterns formed by individual Candlesticks. Thus, they help in recognising significant support and resistance levels while trading in the forex market. It is noticeable; traders find several such Candlestick patterns indicating opportunity during different periods and market volatility.
Traders can know the market’s indecision, identify the continuation process, and receive insight into the balance between selling and buying forex currencies.
What is forex?
The foreign exchange, also represented by the symbol FX, is the exchange of one foreign currency with another. For example, a trader can trade the British pound with the euro. For exchanging currencies, there’s a foreign exchange market, also called the forex market.
Notably, world trade gets channelised by the exchange rate of different currencies. The prices of imports and exports depend on the valuation of a currency. So, the higher the value, the better is the GDP of a nation and its condition. Also, the prosperity index is gauged by it. Thus, multiple utilities come through foreign exchange.
Moreover, there’s no centralised authority that trades forex. Instead, it is an electronic network of different banks, individual traders, brokers and institutions. However, most of the trading happens through brokers and banks.
Interestingly, trillions of dollars get exchanged daily in the forex market. As per the estimate by a reputed survey, there’s a daily transaction of USD 6.6 trillion. The numbers are higher than the collective GDPs of several developing and underdeveloped countries.
Bettings and placement of bids take place in the market, where traders, as per their knowledge, extend their funds on a currency against the others for profits. A learned trader will always have a reason or two, like a central bank’s monetary policy. However, a beginner would not think much about it. So, for them, charts like Bar and Candlestick can script history.
The value of several currencies is determined by the forex market. For the sake of trading, currencies are paired. For instance, EUR/USD, CAD/USD, GBP/USD, EUR/GBP etc.
Each pair will have a price associated with it, like 1.2456. If the price is related to USD/GBP, it will mean that each USD’s cost is 1.2456 GBP.
Forex trading in lots
Currencies trade in lots in forex markets. There are three types of lots, standard, micro and mini. A standard lot is the 100,000 worth of a given currency. Likewise, a mini lot has 10,000, and a micro lot is 1,000.
However, it is entirely different from getting your currency exchange by treading toward a bank. Electronically, you have to trade in currency blocks. However, a trader is bestowed to trade with as many sets of currency blocks.
For instance, a trader can have 50 standard lots (5,000,000), 30 mini lots (300,000) and 10 micro-lots (10,000).
The trading size is something that makes the forex market interesting for traders. The volumes are higher. Thus, it is easier to find buyers and sellers. Moreover, it trades 24/7 for five days a week. So, traders can take time and seek delivery of their currencies. Moreover, if you hold currencies or pairs, you get paid interest for the period you held them.
That’s the added advantage that no other asset offers to market participants. That’s the reason, people are turning to forex traders globally. It cuts down the risk of losing money if you have funds to seek delivery. Also, the volume ensures you can exit and enter whenever you require.
Forex trading with Japanese Candlestick charts
If a trader wants to know insight into the short-term price movement during the forex market, the Candlestick chart makes for an invaluable tool. Likewise, day trading strategies can be easily hatched using these charts.
For example, for a Candlestick chart for GBP/USD, the shadow or the Wick at the bottom would present the lowest levels of currency pair price reached on that certain day. Similarly, the shadow of Wick at the Candlestick’s top would showcase the peak price of the specific trading day for the currency pair.
Different ways of forex trading
Traders have various options for trading in the forex market. And to understand the movement of the market, Japanese Candlestick charts stick like the sun and the moon. Market participants can bid over major, minor and exotic currency pairs as per their pocket’s capacity and knowledge of the market.
Some of the ways are:-
- Position trading
- Scalping
- Day trading
- Swing trading
Day trading
It is the most common type of forex trading that almost everyone uses. Beginners to veterans, almost everyone would go through it. The trade for a day trader closes and opens on the same day. Here, a market player taps in the market’s trends and movements during the day and speculates that. If the prediction is correct, profits can be huge, and if not, losses can cast away every penny. Thus, traders have to be cautious with the frequent price changes.
However, this type of trading is only helpful if you have enough time because the forex market fluctuates quicker than the blink of an eye. So, it is a courageous thing to step into day trading. There are several counter-trend trading and trend trading throughout the day.
A trader needs to use a Candlestick chart for identifying trends, price movements and covering timeframes.
Leverage is the most vital aspect of day trading. Brokers like ABinvesting, 101investing offer at least 1:30 leverage to retail traders. It means, if you invest USD 1000, the broker will allow you to trade currency pairs worth USD 30,000. So, if you can predict the trend accurately, the benefits will be huge for you as a trader. But, likewise, if anything goes wrong, losses can be immense too.
Hence, it is important to pay attention to news alerts provided by good brokers and suggestions offered by experts.
Position trading
As the name signifies, position trading is an important part of forex trading. Traders hold assets for a long time here for profit booking. It is opposed to the concept of day trading, where one has to exit at the day’s end. Taking a position ensures that a trader does not meet with any losses.
So, it is better for beginners or fledgling traders who know nothing about foreign exchange markets. They can invest and relax for sometime by placing their bids for selling.
The margin for error is next to negligible here because market players decide when to sell their currency assets.
Support and resistance are the top most strategies that come in handy during position trading. This type of trading heavily depends on fundamental and technical analyses. The decisions of position traders also rely on trading charts. So, they have to be well prepared while exiting during a market movement.
On a forex analysis chart, a trader must pinpoint or find out resistance and support zones. The zones are places where a price trend may change or reverse or stop its movement.
Breakout trading strategy is one of the essential strategies that a trader uses in making exponential profits. It helps traders to know if there is any other possibility of a burgeoning trend or indicator.
Pullback trading is another aspect of position trading. It is a small or slight drop in the current trade of the forex market. The pause in the current trend can be leveraged by a trader here.
Swing trading
It can be termed as a medium-term style of trading, the advantage of that spring for various forex traders. A market player can hold currency pairs for days to several weeks, considering the market’s swing. Here, entry and exit in the market purely depends on the market swing. Thus, traders enter the market and make the most of the opportunity when the situation is in favour. However, when it is against, they hold it for a period. So, that also works as a pivotal strategy for traders.
Breakdown, breakout, reversal and retracement are some of the most important strategies for market players to use in the forex market.
Reading Japanese Candlestick charts in forex trading
For telling buyers and sellers about the forex market, whether it is bearish or bullish, charts display different colours. Precisely, Candlestick’s body is hollow. The areas below and above the body are known as shadows.
When the market ends lower, the colour that appears on the chart is either red or black. On the other hand, a transparent or green colour shows the market gained at the day’s end. Thus, that’s the representation of profits for traders. Moreover, as a trader, you have to find the specifics for a short time through a chart. There’s nothing better than using the Japanese Candlestick charts for that shorter version. Also, it helps in managing the timing for trading superbly.
Traders look for a bigger chunk of trends in the market that covers a longer time frame. Moreover, looking for opposite trades is also important to counterbalance and make it successful. Thus, people have to identify the trends and make an entry when the reversal takes place.
Conclusion:
Japanese Candlestick charts and forex trading go hand in hand for a trader. Acknowledging a Candlestick chart through its colour, size and body is important for a trader. However, it is not challenging. But the most vital of them all is knowing how to trade in the forex market due to the high volumes and uncertainty of the market.
After understanding how a Candlestick chart works, it is essential to put it into practice when the fluctuations are high. People can learn it through education courses offered by brokers like ETFinance, PrimeFin and Capixal.