
Head and Shoulders Pattern: The Trend Reversal Spotter: Forex trading price charts are more complex than any other market. The prices get affected by several factors and are very sensitive. In this case, there is no certainty about the next turn, the forex market can take. But, there are tools and indicators in the currency trading market which can help.
The Head and Shoulders pattern is one of those patterns. It is not only reliable but also is known for its excellent accuracy in predicting the market trend. Its name is because of its shape on the chart and, today we’ll discuss the essential things related to it.
In this article, we would first understand this technical trend indicator, its price movement on the chart, some crucial components, and lastly, some important go-to-points to remember. A conclusion would follow all this.
Head and Shoulder Pattern in Forex Market
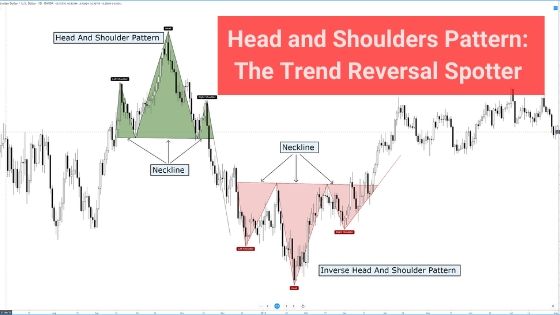
Head and shoulders is a technical analysis pattern which helps the forex traders to determine the reverse up trends. The design includes three major peak lines, of which the ‘middle line’ is the highest trending one. The other two peak lines are somewhat at the same level. As unique as its name, the pattern forms the shape of a ‘head’, ‘two shoulders’, and ‘one neckline’. Here, the head is the highest price line, shoulders are the other two lines, and the neckline is the support price line.
In simple words, the head and shoulders pattern helps to identify an uptrend that has exhausted itself and is likely to reverse the trend. Moreover, this pattern is the most trustworthy and reliable, among forex traders, as it is one of the accurate technical indicators for spotting trend reversal.
Just like Head and Shoulders, we have its brother too here!
Inverse Head and Shoulder in Forex Market
This indicator was developed after the original one and did the exact opposite work of its counterpart. The inverse head and shoulders pattern helps identify the end of a downtrend and the inception of an uptrend of the currency price. It looks like an upside-down hanging ‘head’, ‘shoulder’, & ‘neckline’.
Understanding the Pattern Movements
Uptrend: It indicates that the price first rises to a certain higher level but declines back to the average level. After the fall, the currency price rises again, and this time, above the previous high. Thus, forming the head of the pattern! However, the highest high line also declines, and for one last time, the price line goes up and falls. After this fall, the downtrend has begun. Once the trader confirms this pattern, he should go short or sell the currency, as soon as possible.
Downtrend: The movement of the price line is the same as above. But, this forms after a downtrend, while the above forms after an uptrend. Also, the end of this pattern marks the starting of a bull trend, here. Moreover, once this pattern fully forms, it should be accompanied by buying the currency, by the forex trader.
Important: Other Components
Apart from the main components, i.e. the head and the shoulders, there are some other points too.
Volume: It is a vital component of this pattern. Usually, the Volume should increase when the price line of the last Shoulder is declining. Also, the Volume during the starting of the first Shoulder should be more than the inception of the head.
Neckline: It is the line formed by using the low points of the head, i.e. one point is at the end of the first Shoulder, and second is at the starting of the Right Shoulder. The slope of the neckline also plays a significant role here. The downward moving slope signifies a more dull or bearish forex market.
Price Target: It is anticipated or calculated next price at which the currency will stop after the fall or rise. It can also be identified using many other tools such as Fibonacci and moving averages.
So, these were some essential components. Now, before moving further, you must read these critical points of the head and shoulders pattern, and then quickly end it, after a conclusive post.
Points to Remember
- The head and shoulders pattern does not apply to a stable forex market. The existence of an upward or downward trend is mandatory.
- The left Shoulder must be above the average price trend line of the currency.
- The right Shoulder must cross the neckline. Failure in it will nullify the pattern.
- The support price level should turn into the resistance level for an uptrend head and shoulders pattern, and vice versa for the inverse model.
So, this was all about the head and shoulders pattern. This famous technical indicator is quite tricky to spot. However, once spotted will benefit significantly. Moreover, it is essential to keep in mind that both the shoulders must not be completely identical; they would only show symmetry.
Rounding Up
The Head and Shoulder pattern has not become the trader’s favorite without any reason. It has established itself! First, it is open to all time frames; it can apply to daily, weekly, monthly, or any other duration.
Second, visually easy to spot; thus, any forex trader with little experience can use it. All this makes it the user’s dearest tool. However, it is always best to enter the forex market only when the shape forms and the neckline breaks. Indeed, no forex trading tool is perfect, but it is based upon some right logical price movements.


