Today, there are several technical indicators that you can use in your trading journey. Technical analysis is the first step that should be taken before trading. Doing trading mindlessly without technical analysis is just like wasting all matchsticks hoping that one of them will lighten the room forever. One of the essential tools required for technical analysis is Elliott’s theory. The main use of Elliot waves in technical analysis is to determine price movements.
Wave analysis is based on the Elliott Wave Theory, which states that price charts and economic markets follow certain patterns termed waves. They can then use Elliott Theory to label the price movements. This forecast is based on Elliott Wave theory or Elliott wave principle.
Traders can deduce the story of the waves patterns from the sequence of swings and labels, as well as the expected direction, character, and wave label of the current and upcoming price swings. Once the trader has a good understanding of the prior waves, they can apply the Elliott Wave Theory’s rules and guidelines to forecast the current and future waves.
What is Elliot Wave Theory?
In the 1930s, Ralph Nelson Elliott created the Elliott Wave Theory. The Elliott Theory is a technical analysis theory that is used to explain price fluctuations in the trading markets. Elliott believed that stock markets, which are commonly supposed to function in a haphazard and chaotic manner, moved in predictable patterns.
Elliott was the first to anticipate a stock market after studying several years of stock trading data across numerous indices. Elliott came to the conclusion that observing and identifying a recurring pattern of waves may anticipate stock market movement. To predict market movements and trading opportunities, Elliott waves are combined with other technical analysis approaches and based on certain Elliott wave principles.
This does not necessarily disprove the trend; rather, it signals a stronger period of retracement than the prior corrections witnessed inside the impulsive run.
As a starting point, the application of Fibonacci ratios necessitates a valid Elliott wave interpretation. In terms of Fibonacci correlations within waves, Elliott had two major breakthroughs. First, in Fibonacci proportion, corrective waves tend to retrace preceding impulse waves of the same degree.
The primary emotions of investors and traders in upward and downward swings were reflected in these cycles. These movements were separated into waves, according to him. Fibonacci extensions are utilized to figure out where a primary trend will turn. They show where the motive waves can travel before a downturn in a bull market. They can be used to determine support levels in a down market. Stock price levels at which profits can be realized are measured using Fibonacci extensions.
How Do Elliot Waves work?
There are various types of waves, or price structures, in Elliott Wave theory from which investors might get information. They were created to recognize and predict the stock market’s wave patterns with some Elliott wave principles. Importantly, these patterns aren’t meant to be exact; rather, they’re meant to predict future price fluctuations. The Elliott Wave hypothesis demonstrates that price swings produced by collective psychology always follow the same predictable patterns.
There are no set rules for entrance or exit, and there is no one-size-fits-all approach to trading. The general structure of the Elliott Wave cycle is a combination of a motive/impulsive wave and a corrective wave. The market trades in recurrent cycles, according to the Wave theory, which Elliot linked to investor emotions as well as outside stimuli. EWF chooses to use a distinct definition of motive waves. Impulsive waves move in the same direction as the trend, and we can all agree that the motive/impulsive wave is five-wave long.
According to the hypothesis, it does not matter what timeframe is being studied because a similar pricing pattern is exhibited across all time intervals. A complete Elliot wave cycle is established by the wave pattern. As more degrees of waves are added, the theory becomes more intricate.
The first wave follows the higher degree trend yet the 5-3 pattern of the full Elliott Wave cycle is included within Wave 1 and 2. The key to successfully using the Elliot wave is correctly counting the waves and recognizing the wave in which the market is trading at present. The motive waves, on the other hand, do not have to be in 5 waves.
When the cycle is over, it starts all over again. After the pullback, the market is likely to begin another five-wave climb. The Motive Wave is the first half of an idealized Elliott Wave pattern, a wave that always shows movements in the direction of the trend by one degree.
Talking about the corrective wave, it is a diagonal wave having three sub-waves. The corrective wave makes the net movement in the opposite direction of the trend of the coming largest degree. Corrective wave, thus, is an essential part of the trade.
How to Trade The Third Wave?
Because it provided a simple way to chart the current and past behavior of a multitude with comparable interests. Elliot used the stock market as his primary source of research. The indicator aids in the drawing of the essential retracements by taking into account the peak and the low of the respective move. One of the most extensively acknowledged and used forms of technical analysis is Elliott Wave patterns/theory.
This hypothesis aids in predicting the trend and subsequent correction that will occur in the near future. The identification of trends by Elliott Wave Theory or Elliott wave patterns assists in protecting profit and exiting trades as the trend displays upside and correction. The second/subsequent wave must be complete and follow the main rules of Elliott wave theory in order to identify the third wave.
The third impulsive wave is the most powerful of the three since it includes a lot of market euphoria. It refers to the market’s intrinsic rhythm of crowd psychology, which presents itself in waves. Traders frequently detect the third wave after it has already formed in the majority of cases. Prices fluctuate between impulsive phases that establish the trend and corrective phases that retrace the trend in Elliott waves.
The motive wave, which can be subdivided into five waves and commonly designated with numbers by technicians, is the most basic pattern of market advancement according to Elliott Wave theory.
In the most basic and normal form, impulses and corrections contain 5 lower degree waves and 3 lower degree waves, respectively.
Elliott Wave Theory Applications?
Using Elliott Wave Theory, some technical analysts try to profit from stock market wave patterns. According to the Elliott Wave patterns/ theory, stock price fluctuations may be reasonably forecast by looking at price history because markets move in wave-like patterns influenced by investor sentiment. It was discovered that a motive wave might be made up of three waves rather than the usual five in the real-time market.
Elliott was able to dig deeper into market analysis, recognizing the unique properties of wave patterns and generating comprehensive market projections based on them. A motive wave will be seen in the market, which will be made up of three waves. It’s also feasible that the market may continue to move in corrective waves.
Traders can use price swings in the past to determine their character and direction. Wave analysis is based on the Elliott Wave Theory, which states that price charts and investment markets follow certain patterns termed waves. They can then use Elliott Wave Theory to label the price movements. While higher highs and higher lows usually indicate an uptrend, Elliott Wave theory shows that a lower high and lower low can frequently be seen as a short-term correction from that trend.
Although there are many theories about the nature of the second/subsequent wave, one criterion is that it should never retrace more than the first wave. As a result, traders should maintain a close eye on the second wave in order to trade the third wave successfully.
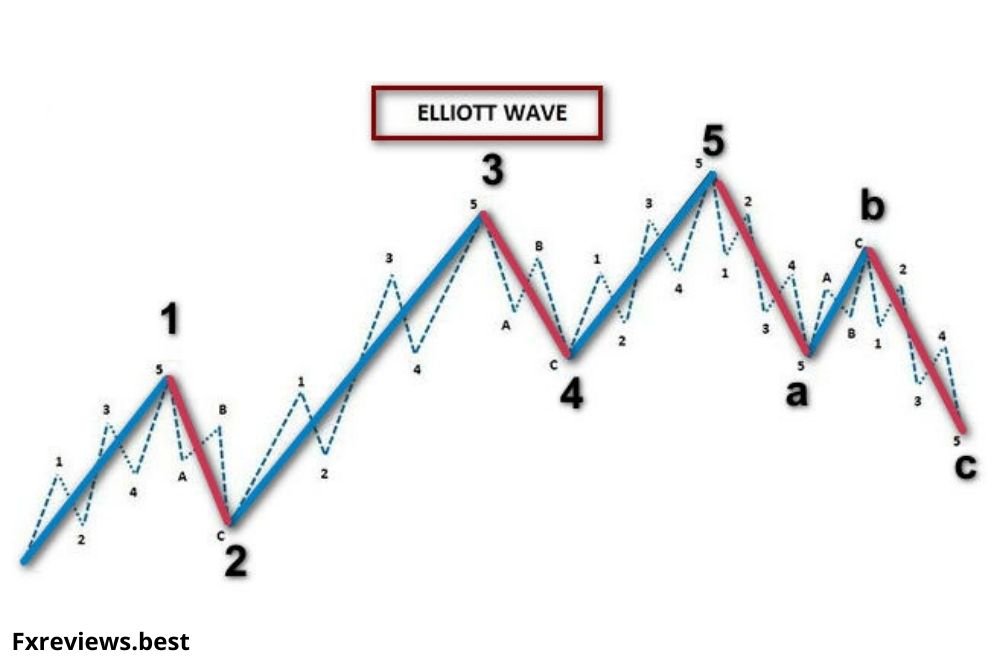
The five waves pattern – Motive and Corrective waves
- In Elliott’s Wave Theory, there are two types of waves: motive and corrective waves. Motive waves are also known as impulse waves. Stock price changes can be forecast because they follow a pattern of up-and-down movements known as waves, which are influenced by investor emotion.
- On the trend scale, market prices rotate between an impulsive wave, or motive, phase, and a corrective phase. Elliott Wave trading analysis provides insights into trend dynamics and aids in a more in-depth understanding of price movements. The stock price is being driven up by one impulsive wave. Five waves make up a motive/impulsive wave.
- An impulse wave consists of five waves and goes in the same direction as the bigger trend, whereas the Elliot corrective waves pattern reverses the trend. Impulse waves have sub-waves that move in the same direction as the next degree trend that is largest. This is the most prevalent and easiest to recognize motive waves in a market.
- The motive consists of five-wave patterns numbered as 1,2,3,4 and 5. The odd-numbered waves have impulsive nature and even-numbered waves make small downward movements after impulse waves. These small downward movements are known as retrace waves. The three-wave correction is used by traders for predicting market movements.
- The motive waves can also be termed or named as a,b,c,d, and e. The b and c are the odd and the even number of the waves that traders study for analysis of the motive waves. Wave b and c are studied and the same way other waves are also considered.
- There is no overlap between waves 1 and 4. Out of the three impulse waves, wave 3 cannot be the shortest wave. Finally, wave 2 will always be shorter than 100% of wave 1.
- The wave b or 2 waves is the even wave and gives downward movements.
- The assumption that fractal patterns reoccur in financial markets underpins this trading approach. To build larger patterns, these impulse and corrective waves are nested in a self-similar fractal. This Elliott wave interpretation could lead to a long-term bearish viewpoint with a brief bullish viewpoint for a trader.
Wave Degrees
Elliott classified the waves into a number of categories or letters like wave b, highlighting the fact that the same patterns can be found on both short and long-term charts. Elliott Wave degree is an Elliott Wave language for identifying cycles in order for analysts to determine the location of a wave within the overall market trends.
The degree of each wave is identified using a labeling convention. Cycle degree is found in weekly and monthly time frames, whereas Subminuette degree is found in hourly time frames. Elliott defined nine degrees of waves that might span hundreds of years to short-term intraday fluctuations.
The wave degrees Elliott identified are highly useful in studying the market trends and providing a successful trading experience.
Here are the nine various categories of degrees.
- Grand Super Cycle
- Super Cycle
- Cycle
- Primary
- Intermediate
- Minor
- Minute
- Minuette
- Sub-Minuette
How these different degrees are structured?
- Supercycle waves consist a Grand Supercycle.
- Cycle waves consist of Supercycle waves.
- Primary waves consist of Cycle waves.
- Intermediate waves consist of Primary waves.
- Minor waves consist of Intermediate waves.
- Minute waves consist of minor waves.
- Minuette waves consist of Minute waves
- Subminuette waves consist of Subminuette waves.
Counting the waves is a difficult process, and a bad count of the trade, or in most situations, a bad count, can render the analysis incorrect. Elliott wave analysis is also subjective, which could lead to erroneous conclusions and perhaps disastrous trade entries.
Traders should only focus on the third wave of Elliot wave theory to avoid this. Traders can easily enter the third wave by detecting the trend. This strategy allows us to enter the market early and gives us the added benefit of profit booking. Other technical indications are also compatible with the Elliot wave approach.
The major focus of this hierarchy is to explain these various categories in detail so that traders do not get confused and place their trades carefully according to the wave theory.
These nine-degree types just seem nine on paper but in reality, they can be more than a grand supercycle and less than even sub-minute.
Bottom Line
Elliott Wave theory continues to bring a feeling of structure to markets for many individuals throughout the world. Practically, the Elliott Wave Principle, like all other analysis methodologies, has its supporters and detractors. There are several indicators in the market that you can use but it is very important to focus on the technique and furnish your skills to get the best trading results. If you start trading without doing any technical analysis, that can be quite painful as it creates higher chances of potential risks.
If you want to mitigate the risks and perform your trading in favorable conditions to maximize your profits. ABInvesting is the best for you as it is important to first practice your trading on a free demo account. Moreover, traders can even enhance their knowledge on motive and corrective waves using the educational tools of the brokers with other facilities.